
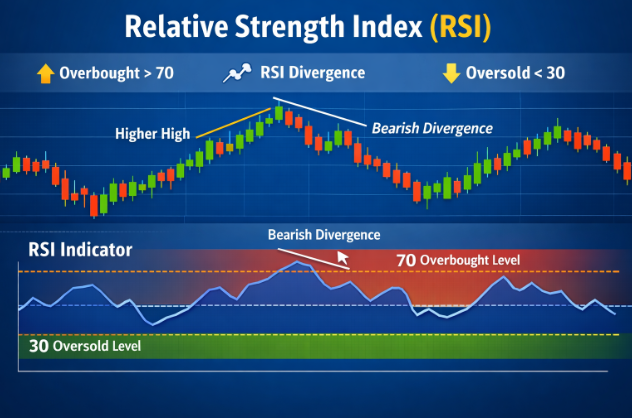
RSI divergence occurs when price makes a new high but RSI makes a lower high (bearish), or price makes a lower low while RSI makes a higher low (bullish). It signals weakening momentum — useful for swing traders on Zynex who want entries near turning points rather than mid-trend.
Divergence alone is not a signal. It is a warning. Combine with structure: support/resistance, trendline breaks, or candlestick confirmation before risking capital.
Bullish divergence playbook
- Identify downtrend or range on daily/4H
- Price prints lower low at known support
- RSI (14) prints higher low — divergence
- Wait for bullish engulfing or break of minor descending trendline
- Stop below divergence low
- Target next resistance or 2–3R
Bearish divergence playbook
- Uptrend on NAS100 or XAU/USD
- Price new high at resistance
- RSI lower high
- Bearish rejection candle or support trendline break
- Stop above divergence high
- Target prior swing low
Best timeframes
4H and daily divergence are more reliable than 15-minute noise. Intraday divergence on Zynex scalping charts produces many false positives — filter with higher-timeframe bias.
Filters that improve win rate
- Only trade divergence at weekly support/resistance
- Require volume proxy expansion on confirmation candle
- Avoid counter-trend divergence during strong news trends
- Maximum 2 divergence trades per instrument per week
Divergence tells you momentum is fading — confirmation tells you direction may change. Never skip the second step.
Trade smarter with Zynex
Open a CFD account for forex, indices, commodities, and crypto — competitive spreads, fast execution, and pro charting tools.