
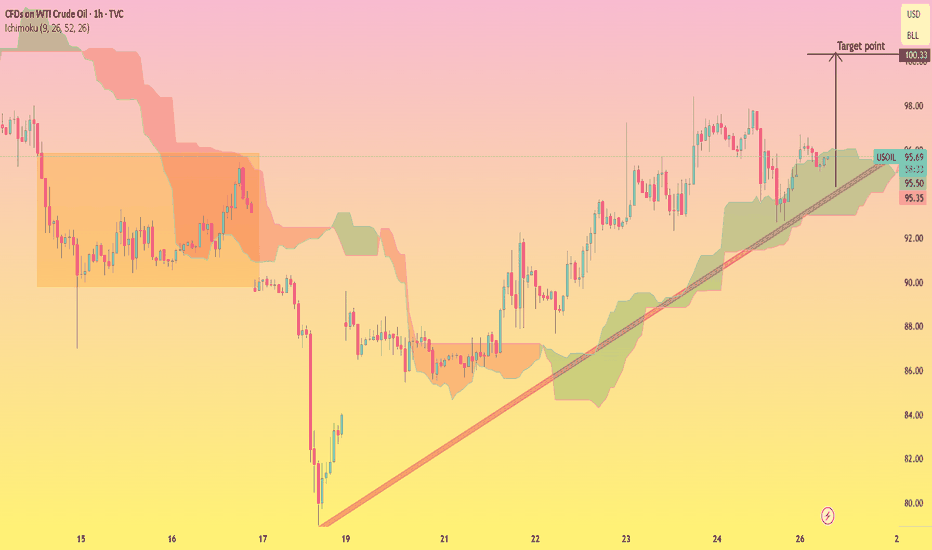
WTI crude oil CFDs remain a core commodity instrument for macro traders on Zynex. Energy prices respond to inventory reports, OPEC+ guidance, geopolitical supply risk, and global growth expectations — creating trend phases and sharp reversals.
Recent API and EIA inventory prints showed mixed signals: crude builds pressured prices temporarily, but supply discipline narratives and Middle East headline risk limited downside follow-through. Price continues to oscillate around the psychologically important $80/barrel zone.
WTI technical levels
| Zone | Significance |
|---|---|
| $82–$84 | Near-term resistance band |
| $80.00 | Pivot — bull/bear line for swing bias |
| $77.50–$78.00 | Support from prior consolidation |
| $75.00 | Breakdown target if demand narrative weakens |
Catalysts this week
- EIA weekly report: crude, gasoline, and distillate stocks
- OPEC commentary: production guidance moves front-month pricing
- USD correlation: stronger dollar often weighs on oil
- Global PMIs: demand expectations for industrial energy
Strategy notes
Breakout traders: look for daily close above resistance with stop inside range — oil trends can run when inventory trend confirms direction.
Range traders: fade extremes with tight stops; energy CFDs can accelerate quickly on headlines.
Hedging context: oil longs can offset inflation anxiety in diversified CFD portfolios — but correlation shifts during recessions.
Monitor live WTI and Brent CFD pricing on Zynex before placing energy trades.
Trade smarter with Zynex
Open a CFD account for forex, indices, commodities, and crypto — competitive spreads, fast execution, and pro charting tools.